
Not Financial Advice!
Hi everyone. So many of you have reached out asking what I am doing at the current level in Bitcoin. I get it. The market has been volatile, Bitcoin has pulled back, and you are sitting on the sidelines wondering if you missed the move or if there is still an opportunity.
Let me walk you through exactly what I am looking at right now.
For me personally, I ADDED IBIT LEAPS when we were back when Bitcoin was $62,000. I bought the IBIT LEAPS for June 2028 and I rolled them forward to December 2028. I covered that roll in a previous Market Minute. It was roughly a 3.3% cost for that roll, which is well within my comfort zone. If you watched that Market Minute, you saw me walk through the IBIT LEAP structures in detail.
But some of you have not entered yet. You are trying to figure out when is a good time. Is it too late? I want to go through the technicals real quick and show you what I would be looking at right now if I am sitting on cash and I have not added Bitcoin.
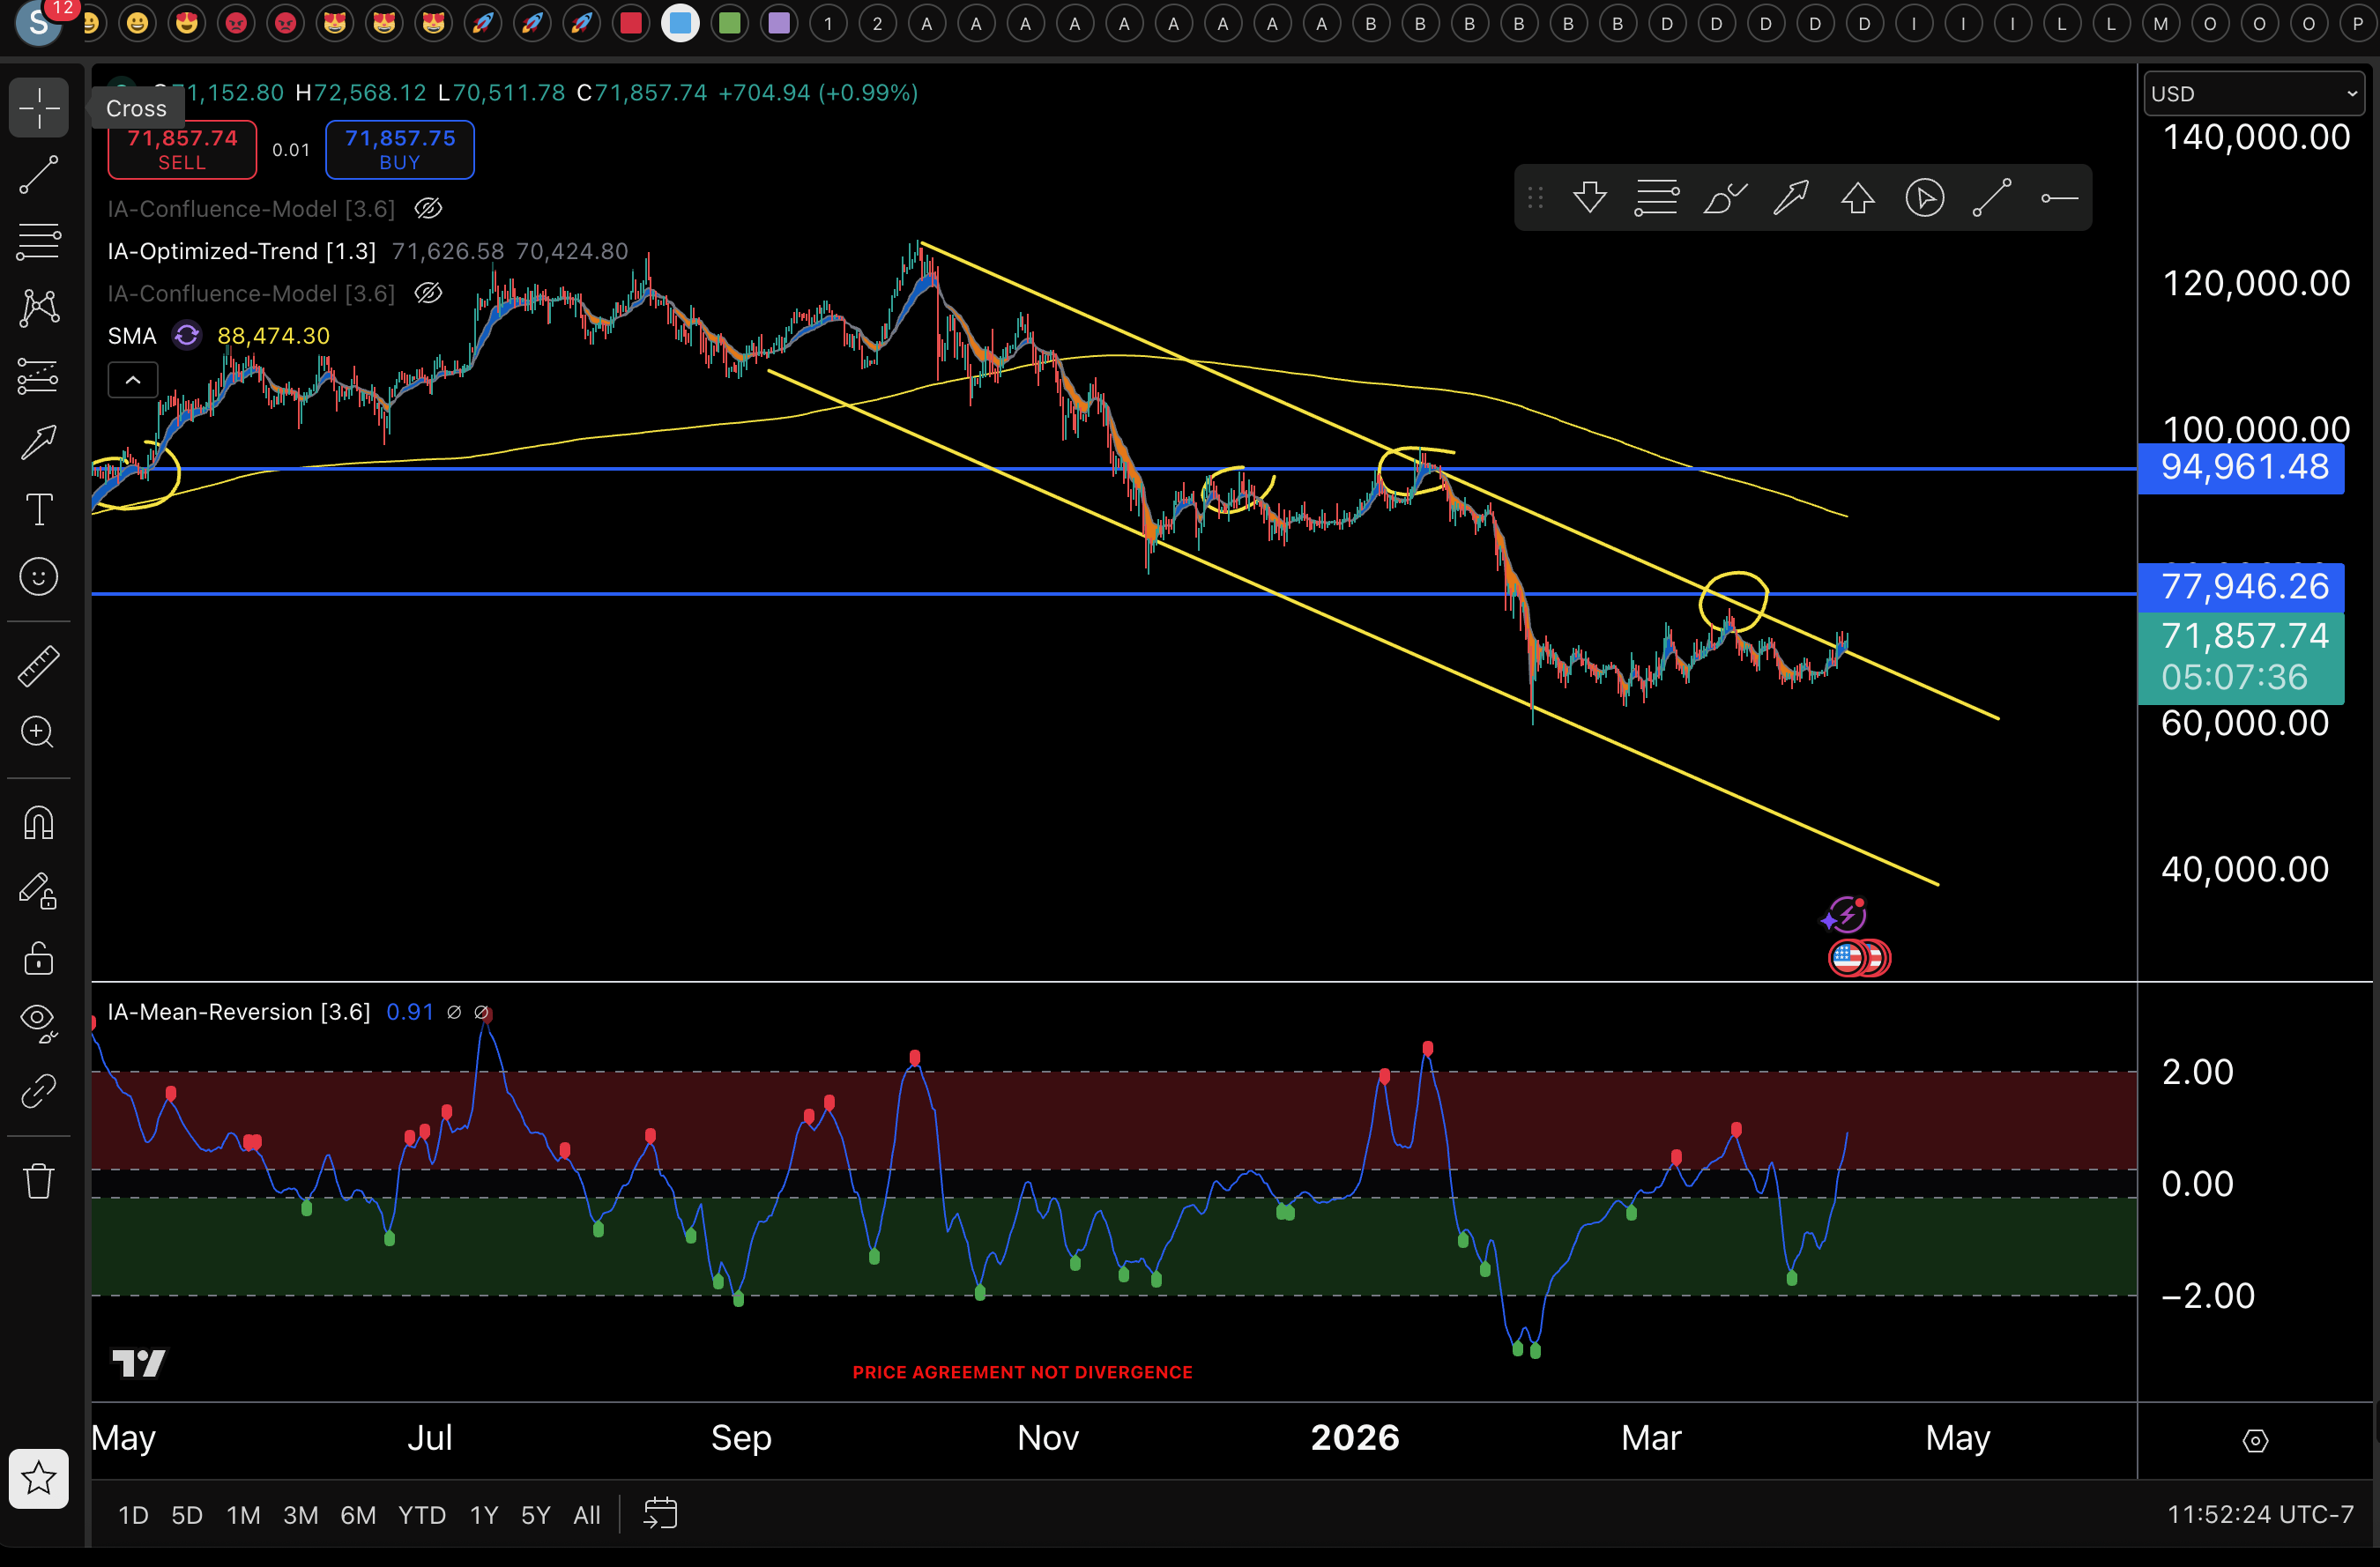
This is a 12- hour IADSS chart. If you have taken my courses, you know I use a 4-hour IADSS chart for 90% of my income trade decisions. But for LEAPS and major entries, I step up to the 12- hour timeframe. I teach this in Course 202, where I explain that LEAPS are entered at very critical key market bottoms, not off of 4- hour charts. The 12-hour gives you the bigger picture.
On the chart below, you will see I have a downward trending channel. We have tested it multiple times and held the low multiple times. We are trying to break out.
So what are the three scenarios for entry?
Scenario One: The True Technical Breakout
This is the textbook entry. We clear the resistance at the top of the channel, we clear the 200 moving average, we clear the 95,000 resistance area, and we close above 100,000. These are all Bitcoin numbers. That is scenario one.
But here is the thing. You are leaving a lot of money on the table. Remember, Bitcoin is at roughly 70,000 right now. So if you wait until 100,000, you are giving up nearly 50% of the upside. That is a significant amount of opportunity cost just to feel safe about a confirmed breakout.
Scenario Two: The Kissback
So I start to look for scenario two. We break out of the downward trend channel. We do what I call a kissback. We test the top of the channel from above, it holds, and we head back up.
Scenario Three: The Lower End of the Channel
This is the level I will be personally adding more at IF WE GET THERE, the lower end of the channel, which will be roughly in the low $50,000 area. Do I think we are going to get there? I truthfully don’t know, which was why I entered at $62,000. Bitcoin has been extraordinarily strong through the last few weeks. But nonetheless, I am here to show you the levels. Picky, picky, picky.
Being that I bought at $62,000, am I adding here at 70,000? No. Would I add on a dip? Absolutely. If I hadn’t bought at $62,000 would I be adding in here, yes, but not ALL of my money would go in here. I’d be stacking more the lower we go.
Using DCAS If You Are New to Technicals
So what tools could you use as a new trader if you are not comfortable with all these technicals? The answer is DCAS.
The Bitcoin DCAS chart is telling you everything you need to know right now. It is paving the way. When we were at higher levels in the $80,000s, notice how it said 1.66 and 1.96. What does that mean? If you had $1,000 to allocate per week, it would want you to put in 1.66 times that amount. So $1,660 here, $1,960 here, $2,600 here. It keeps getting you in at strategic levels.
The key insight is that the risk is getting reduced at these lower levels. That is why the allocations are getting higher. The DCAS tool does the math for you.
What other chart is showing the same story? MicroStrategy. Same pattern. The entire drop from the highs, not one buy was flagged. Now we are getting into these lower ranges and you are starting to see the flags at 2.33, 2.26, 2.32. In a previous Market Minute, I walked through the MicroStrategy entry levels I am watching and how I am funding those entries.
The Risk/Reward Math
Let me put a number behind it. With Bitcoin down at $70,000, let's say our bottom is at $50,000. Our risk is $20,000. Now let's say you buy at $70,000 and we run to $126,000. That is a $56,000 gain on one Bitcoin. The risk is getting smaller and the risk of missing the upside is getting larger. You need to be aware of that.
IBIT LEAPS for December 2028
So what I did was take the liberty of showing you a couple of IBIT LEAPS. If you are somebody who says, I want to do this with options and in December 2028 I am going to buy my IBIT by exercising my calls, here is what I would look at.
The 12/2028 $20 call was trading at $27. Break even is $47.
The 12/2028 $25 call was trading at $24. Break even is $49.
The 12/2028 $30 call was trading at $21.50. Break even of $51.50.
These are all good. Which one is the 50/50 intrinsic to extrinsic? The $30 call. That is my rule of thumb. I like that 50/50 intrinsic to extrinsic ratio or more. I talk about this extensively in Course 202, 301 and 302.. My rule is: in the money, 50/50 intrinsic to extrinsic, and I try not to pay more than one third the price of the stock.
I personally like the $25 call. There is no right or wrong answer. You just need to understand what your break-evens are going to be in the future. How much does IBIT have to rally by December 2028? Today IBIT is at $41. All of these work for me.
My Next Move
I have already bought multiple levels here. My next purchase would be wherever IBIT is when Bitcoin hits $50,000 (IBIT near $29). At that point, I would probably be looking at the $20 or $25 call or whichever LEAP in 12/2028 has 50/50 intrinsic extrinsic value.
What else might I do? I might take my $30 call and see if I could roll it down to the $20 call for less than 30 cents on the dollar. Meaning, if I sell the $30 call and roll it to the $20 call, that is a $10 roll. I would pay max $3 and lower my basis. That is the same 30% max debit rolling rule I have demonstrated in prior market minutes.
One More Closing Point
The Tabi model is dark blue now and that is really signaling that we are getting closer to the tail end of this downdraft. So I hope this was helpful.
I hope this gives you a clear roadmap for how to approach Bitcoin at these levels, whether you are using technicals or DCAS for entries. Thank you so much for watching.
|